


Transaction Center
Time to bring it home. Find zipForm®, transaction tools, and all the closing resources you'll need. Except for the champagne — that's on you.
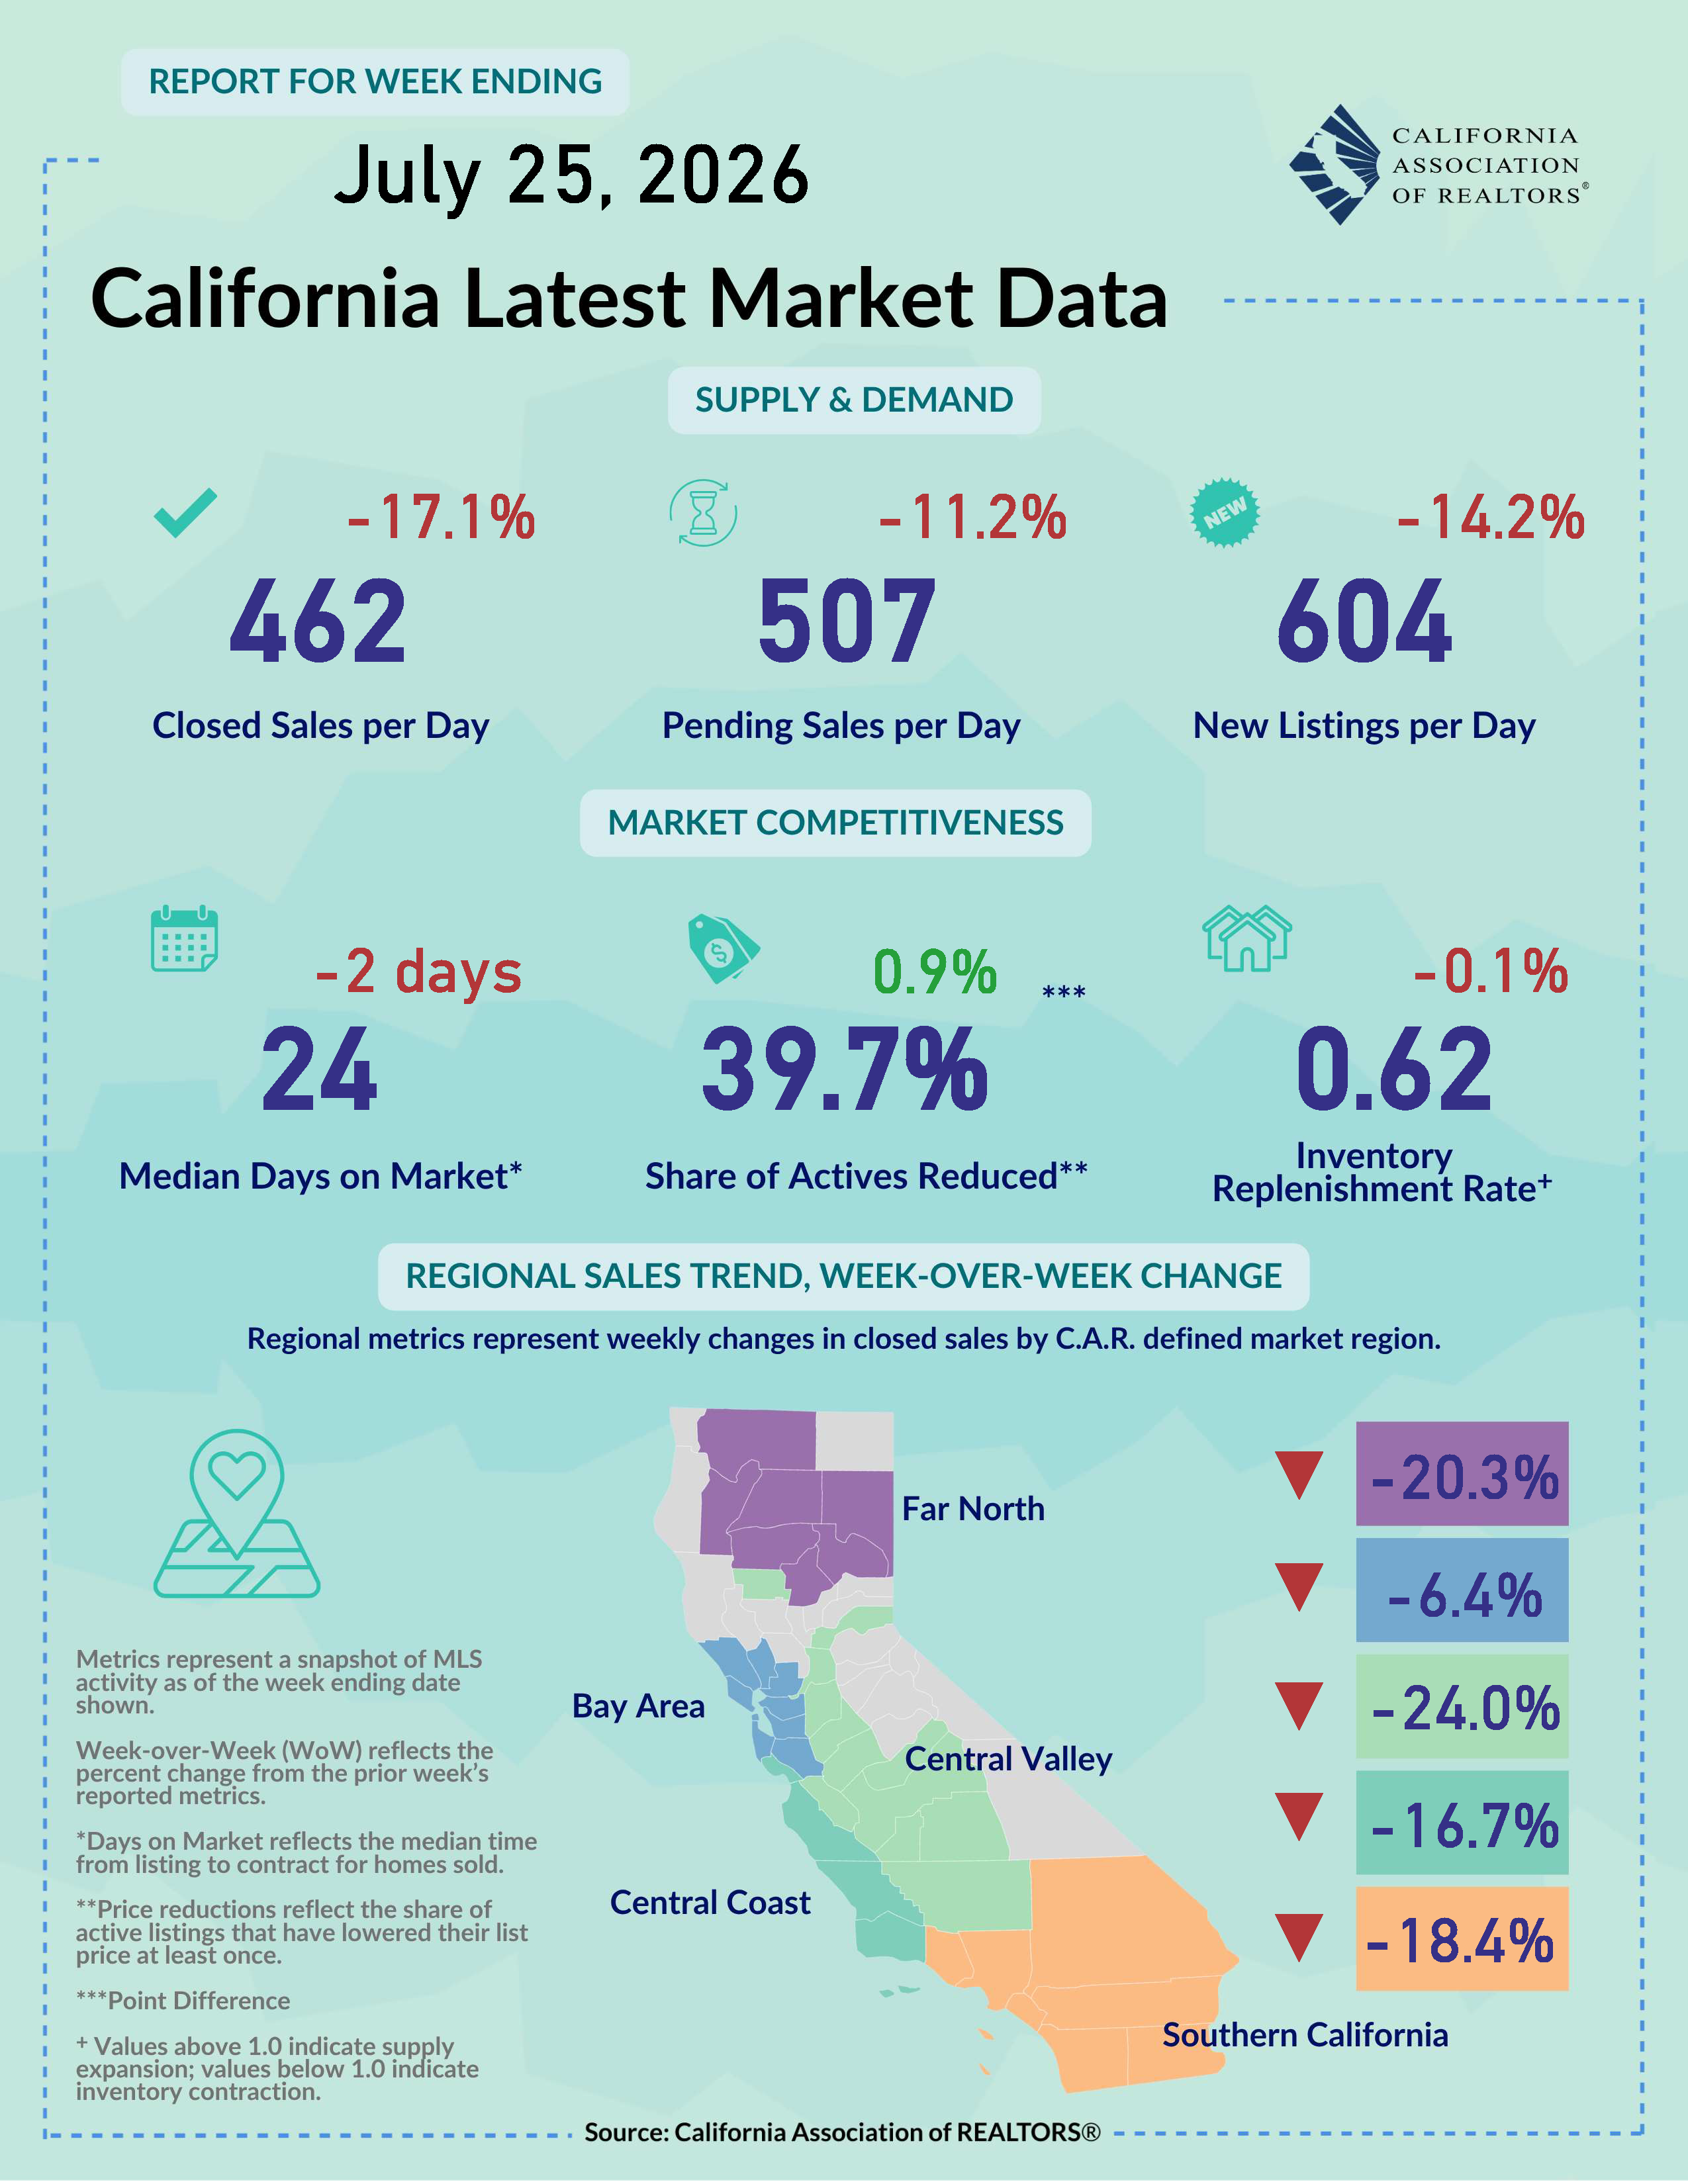
View the latest sales and price numbers. Find out where sales will be in upcoming months.
Get a roundup of weekly economic and market news that matters to real estate and your business.
Gain insights through interactive dashboards and downloadable infographic reports.
All Shareable Reports All Interactive DashboardsCatch up with the latest outreaches and webinars by the Research and Economics team.
C.A.R. conducts survey research with members and consumers on a regular basis to get a better understanding of the housing market and the real estate industry.
California Model MLS Rules, Issues Briefing Papers, and other articles and materials related to MLS policy.
Looking for information on how to file an interboard arbitration complaint? You've come to the right place! Find the rules, timeline and filing documents here.
Summaries and photos of California REALTORS® who violated the Code of Ethics and were disciplined with a fine, letter of reprimand, suspension, or expulsion.
The most recent edition of the Code of Ethics and Standards of Practice of the National Association of REALTORS® along with other important links to NAR information.
The California Professional Standards Reference Manual, Local Association Forms, NAR materials and other materials related to Code of Ethics enforcement and arbitration.
C.A.R. advocates for REALTOR® issues in Washington D.C., Sacramento and in city and county governments throughout California.
CREPAC, LCRC, IMPAC, ALF and the RAF comprise C.A.R.'s political fundraising arm.
The RAA: Protecting REALTORS® and Homeownership REALTOR® Action FundC.A.R. Senior Vice President Sanjay Wagle sits down with former Senate Majority Leader Emeritus Robert Hertzberg to discuss the proposed Middle-Class Homeownership and Family Home Construction Act.
Learn how you can make a difference, by getting involved yourself or by passing along valuable information to your clients.

|
July 27, 2026 - The economy and the housing market continue to show signs of resilience, with small business optimism improving, new-home sales stabilizing, and foreclosure activity remaining below historical norms. The market, nevertheless, could face renewed headwinds in the coming months as the unsettled Middle East conflict keeps energy prices elevated, adds upside risk to inflation, and complicates the interest-rate outlook. With affordability already stretched and buyer confidence fragile, any sustained geopolitical shock could slow momentum and keep housing demand subdued in the months ahead. Small business optimism bounces back in June: Owners of small businesses gained some confidence back last month as the NFIB Small Business Optimism Index climbed 2.1 points from May to 97.4 but remained below the 52-year average of 98.0 for the fourth consecutive month. With the signing of the US-Iran ceasefire memorandum of understanding on June 17, energy prices were lowered and provided some well-needed relief for businesses last month. The easing of geopolitical tensions also pushed the Uncertainty Index down by 2 points from May to 89 but continued to stay well above the long-run average of 68. The share of owners who reported higher nominal sales inched up 1 point from May to a net -4%, while the net percent of owners who expected higher real sales volume over the next quarter rose 8 points. More business owners decided to hike prices in June, as the net percent who raised average selling price climbed 2 points, but near-term price outlook improved slightly as the share of owners who planned to raise prices in the next three months dipped 2 points from May. With the war restarted in early July and oil prices spiking up sharply in the past two weeks though, inflation will likely see more upward pressure in July, and business optimism could see a reversal in the upcoming report. U.S. new home sales bounce back but sales in the West plunge to 12-year low: Sales of newly constructed single-family homes in the U.S. recovered slightly from May with an increase of 1.6% and reached a seasonally adjusted annualized rate of 628k, as mortgage rates moderated in June and consumer confidence improved due to the signing of the ceasefire agreement. On a year-over-year basis, new home sales remained down from a year ago by 5.6% at the national level. Three of four regions in the U.S. declined from a year ago, with the West falling the most by 24.6% from May 2025. June’s sales level in the West, in fact, dropped to the lowest level since July 2014 when the housing market was still recovering from the collapse that started during the 2008 housing crisis. With sales improving from May, new-home inventory dipped slightly, pulling months of supply down to 9.3 months from 9.4 months in May but increasing housing supply from 9.0 months in May 2025. Despite an increase in months of inventory, for-sale new housing units continued to decline by 3.2% from a year ago as developers have slowed down on building new homes due to concerns about their growing backlog of unsold homes. Builder confidence declines again as costs and demand concerns remain: U.S. homebuilder sentiment released by NAHB/Wells Fargo moderated again with the index sliding two points to 34 in July and remained below 40 for the 15th straight month, a streak not seen since 2011-2012. The Housing Market Index’s (HMI) measure of sales expectation in the next six months dopped two points to 43, while the measure on traffic of prospective buyers also dipped two points from the prior month to 23. More builders are cutting prices in July, with the share climbing to 37% from 35% in June. With mortgage rates remaining elevated and the Middle East conflict lingering on, the market for newly built homes will likely see soft housing demand at the start of the third quarter as homebuyers take the wait-and-see strategy in the near term. Foreclosures up from last year but remain below pre-pandemic levels: U.S. foreclosure filings decreased again on a month-over-month basis but remained on a double-digits increase from 12 months ago in June, as rising homeownership costs continue to put pressure on homeowners. According to ATTOM, there were a total of 39,327 U.S. properties with foreclosure filings last month, a decline of 3% from May but a surge of 21% from June 2025. At the national level, one in every 3,656 housing units had a foreclosure filing last month, while California had one foreclosure in every 3,205 homes. The Golden State had the 9th highest foreclosure rate among all states in June, while Florida (1 in 2,106) topped the chart last month and Vermont (1 in 24,217) came in last. Lake, Shasta, Sutter, and Mendocino were the counties in California with the highest foreclosure rates last month. While the sharp increase in filings in the U.S. from last year suggest that homeowners are facing greater financial strain compared to a year ago, strong homeowner equity and disciplined lending practices continue to put a cap on default activity. With foreclosure volumes staying well below the historical norm, housing fundamentals remain sound amid a market with soft demand. Racial inequality in homeowners insurance premium creates affordability issues for Black and Hispanic households: The Consumer Federation of America’s report, Redlined: The Persistence of Racial Inequality in the Cost of Homeowners Insurance, found significant racial disparities in homeowners insurance premiums across the U.S. The study compared the cost of identical coverage for hypothetical homeowners and found that residents of predominantly Black and Hispanic communities paid substantially more than those in predominantly White communities for the same protection. At the national level, homeowners in majority-Black zip codes paid on average 16% more, or about $500 annually, while those in majority-Hispanic zip codes paid 30% more, or roughly $950 per year. In California, the Black racial premium gap was 16% or $280, and the Hispanic racial premium gap was 4% or $63. While the disparities at the state level were lower, the persistence of racial inequality in the cost of homeowners insurance is still an alarming concern, as these modern-day insurance “redlining” practices continue to create housing affordability issues and limit wealth-building opportunities in communities of color. Note: This summary report gets updated every Monday by 6:00 pm PST. Feel free to email us at [email protected] if you have any questions and/or feedback.
|
|